The Ultimate AWS Cost and Usage Report (CUR) Guide

September 12, 2024
Guides
AWS is big. So big, in fact, that it’s comprised of over 200 fully featured cloud services that could power just about any use case you could think of. With so many features and capabilities, it’s no wonder AWS is the most widely-adopted cloud provider today, claiming nearly a third of the total cloud market share.
AWS offers a vast array of services and features, enabling developers to build and scale with incredible flexibility. However, managing costs across this growing ecosystem can be challenging. As your development teams dive into these powerful tools, your finance team may find it tricky to track exactly where expenses are coming from across 200+ services.
Let’s take a moment to empathize with the financial side of things. It might seem simple to answer questions like:
- Which Lambda functions belong to team Foo, and how much did those functions cost the company last month?
- Team Bar ran a load test last week in preparation for an upcoming feature launch. How much did that load test cost, and how can those costs be broken down by service?
- After switching their DynamoDB tables from provisioned capacity mode to on-demand, how much did team Bar save last month?
Ideally, answering these questions would be straightforward. But without the right tools and setup, it can be hard to know where to start.
But there is good news. What if we told you AWS had a native, and best of all, free solution to help you understand every little detail about your costs?
It’s called the AWS Cost & Usage Report, or CUR for short. This guide will cover everything you need to know about the CUR as well as its latest feature, AWS Data Exports.
What is the AWS Cost and Usage Report (CUR)?
The AWS Cost and Usage Report, or CUR for short, is exactly what it claims to be: a detailed report that breaks down all of the cost and usage metrics related to your account. More specifically, here are some key features of CUR:
- You can configure AWS Cost and Usage Reports to publish CSV report files to an Amazon S3 bucket.
- CUR can update your reports up to three times a day.
- You can choose to break down your costs by hour, day, or month.
- CUR also breaks down costs by service, resource, and user-defined tags.
- CUR integrates natively with Amazon Athena, Amazon Redshift, and Amazon QuickSight for data analytics.
The CUR is the single source of truth when it comes to billing. At the end of the month, the sum of all the costs in the CUR should add up perfectly to your monthly AWS bill. Additionally, if you’ve ever used AWS Cost Explorer, that service actually uses data from the CUR under the hood to generate those neat-looking visualizations.
Say Hello to a Sample CUR
So what does a sample CUR actually look like? Well, we’re glad you asked… or are we?

Here’s what you might see if you try to view the CUR using Excel or Numbers. Immediately, you’ll notice that the CUR is absolutely gigantic–you might even have trouble opening the file without Excel crashing. AWS Data Exports can somewhat mitigate this problem, but we’ll discuss that more in the next section.
For now, you might notice that some of the column names can seem very cryptic. To better understand the data that the CUR provides, you can refer to the data dictionary in the AWS documentation. For example, the dictionary lists bill/BillType as an enum with three possible values: Anniversary, Purchase, and Refund.
All this means is that data in the CUR is very comprehensive and customizable, which is definitely a huge plus. However, the CUR was never really designed to be consumed by humans. You’re much better off using a data analytics tool, and we’ll revisit this later in this article.
AWS Data Exports and the CUR 2.0
We’ve hinted at Data Exports a couple of times already, so let’s put an end to the gatekeeping. What are they, and what’s all the buzz about?
To understand Data Exports, let’s first talk about the Cost and Usage Report (CUR) 2.0. CUR 2.0 offers a more consistent and predictable schema, nested data for reduced data sparsity, and two additional columns to help with billing account identification. All newly-generated Cost and Usage Reports now use the CUR 2.0.
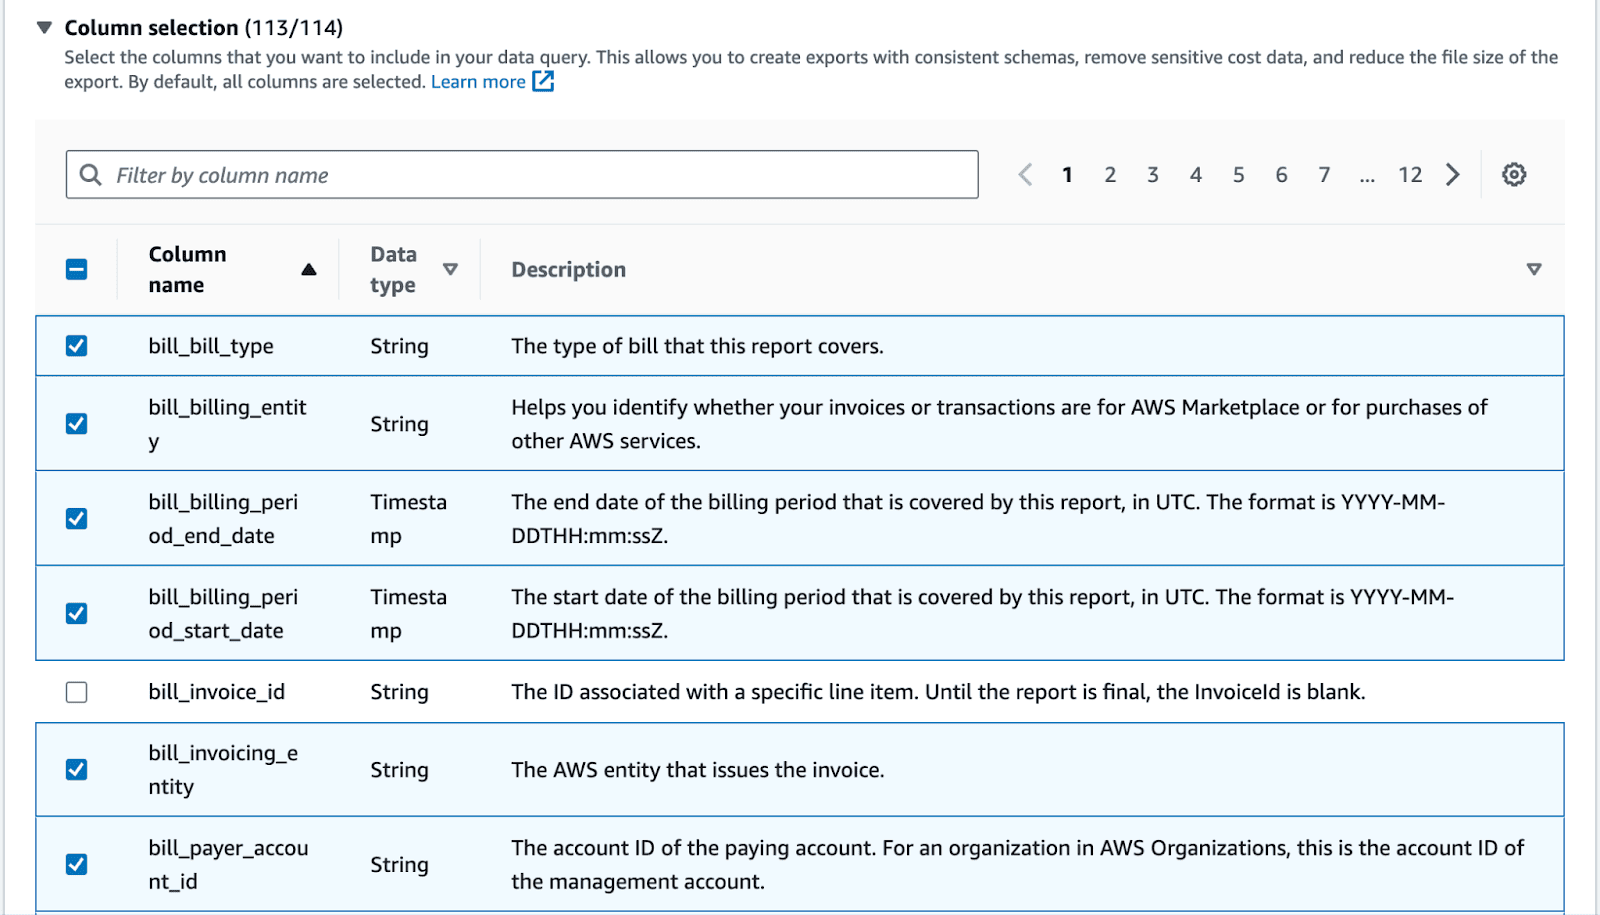
AWS Data Exports is a feature on top of the CUR 2.0 that allows users to export just the relevant billing and cost management data rows and columns that they want. This means that instead of having to consume the entire CUR, you can simply exclude any columns that you don’t need during CUR setup. If done right, this can significantly reduce the size of your CUR, help you customize your CUR to match any existing data pipelines you have, and save money on data storage costs. It’s a win-win-win.
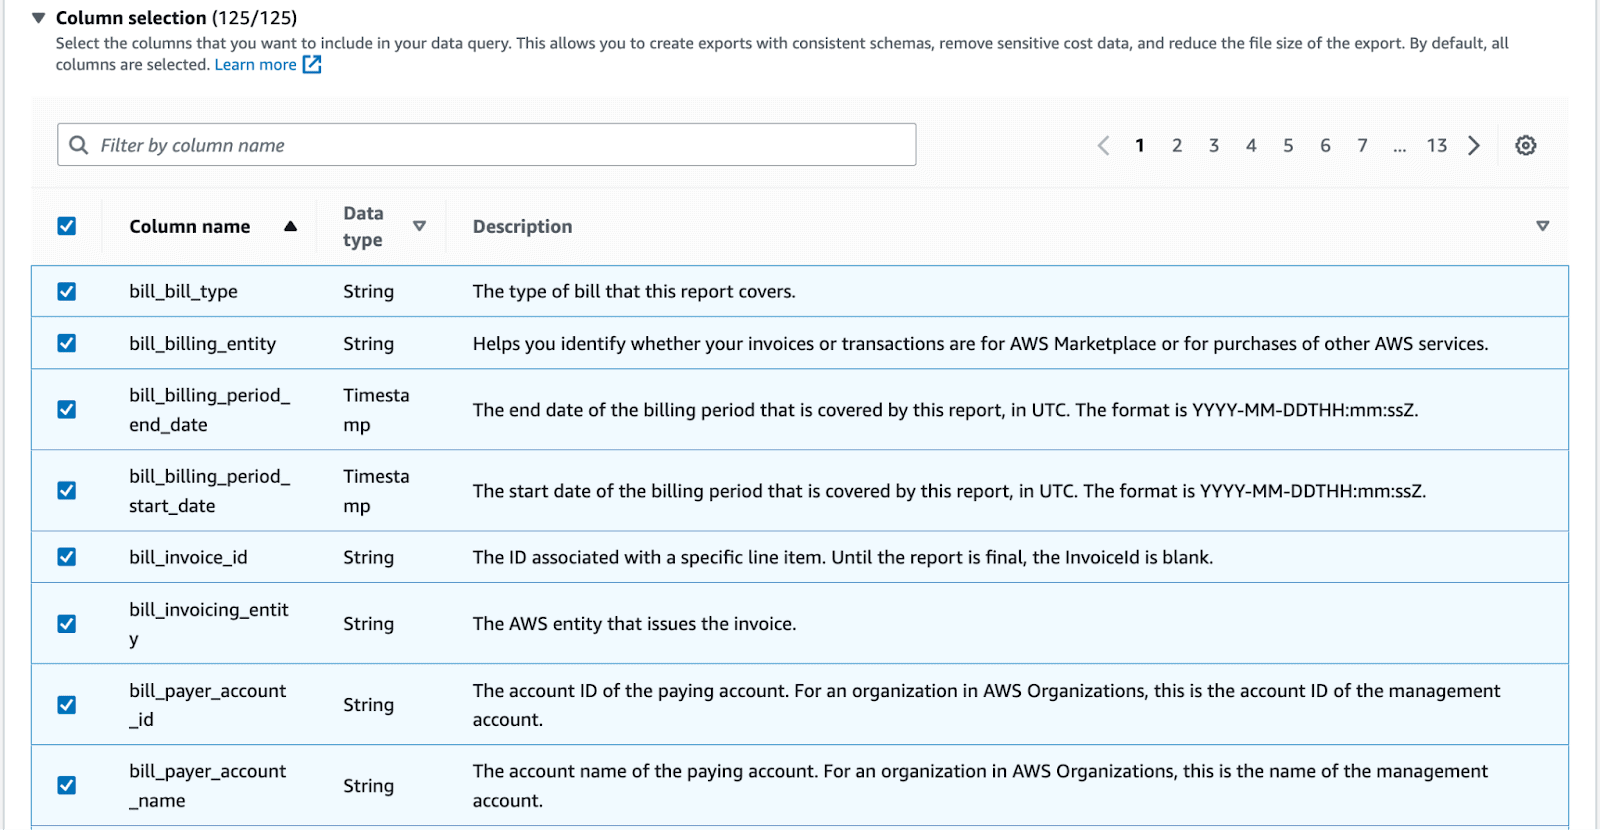
So what does a Data Export look like compared to the CUR? Well, mostly the same, but this would depend on what columns you choose to include in your export. Let’s suppose you uncheck the `bill_invoice_id` column during setup:
If you open the corresponding export in Numbers or Excel, `bill_invoice_id` is nowhere to be found:
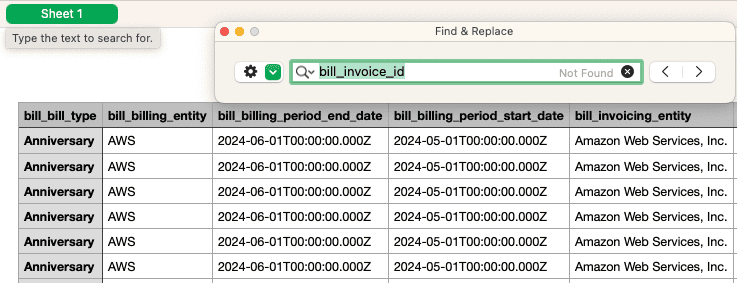
This illustrates the infinite power of Data Exports: use the column selection feature to your advantage. You can significantly cut down the size of your CUR if most of the columns aren’t useful to you.
Another important change you might have noticed is the reformatting of column names. For example, in the older version of the CUR, there was a column named `bill/BillingEntity`. This has been reformatted to `bill_billing_entity` in CUR 2.0-land.
Where Are AWS Cost and Usage Reports Stored?
CUR files live in S3. When you create a CUR, you must specify an S3 bucket as the destination. AWS can update your report up to three times a day. Here, “update” can either mean overwriting the previous report version, or delivering a new report in addition to previous versions. You can configure this during the CUR setup.
Are AWS Cost and Usage Reports Free?
Yes, the CUR is absolutely free, so you should definitely take advantage of it!
Why Should I Use the CUR?
There are many reasons to use the CUR (for starters, did we mention that it’s free?). Here are three of the most important ones:
- Cost and usage are difficult to see otherwise. AWS doesn’t give you many options when it comes to understanding costs. The Cost Explorer tool is great for getting a high-level overview of your costs, but anything more granular requires a more powerful tool like the CUR.
- The CUR lets you see what you’re spending in detail. Like we mentioned in the previous section, the CUR has a ton of columns. It can tell you everything you need to know about your spending broken down by service, resource, or any custom categorization method (using tags).
- Use the CUR alongside other AWS services to gain valuable insights. You can harness the full power of the CUR with services like Athena, Redshift, or QuickSight. This can help you detect things like cost anomalies and figure out how to optimize your AWS usage.
Common CUR Use Cases
The CUR is useful for everyone. However, you’ll have to customize how you use the CUR depending on the extent of your application, and the size of your team. Here are a few common CUR use cases:
- If you’re a solo hobbyist developer, the native CUR settings will probably suffice. While Cost Explorer allows you to see your costs broken down by service, you might use the CUR to get a more detailed breakdown of your costs by resource (i.e. specific DynamoDB tables or Lambda functions). Also, Cost Explorer only shows you up to 12 months of past usage data. Since CUR files are stored in S3 forever, this allows you to retain a full copy of your past cost history.
- If you’re a software team with multiple developers and services, you might capitalize on the more advanced capabilities in the CUR to leverage its full potential. For example, you could use tags to categorize your resources by the services that they are a part of. You can then use the CUR to understand the costs of each of your services, broken down by the resources that support it.
- If you’re on a contract with AWS for an AWS Savings Plan, you can use the CUR to track Savings Plan usage. You’ll get specific columns detailing things like your savings plan rate and effective cost.
How Do I Create an AWS Cost and Usage Report?
Alright, enough talk about benefits and use cases–hopefully by now, you’re sold. On to the fun part–setting up the CUR in your AWS account.
Who Can Create a CUR?
In AWS, permissions are always governed by IAM, and the CUR is no exception. Any IAM user with the `cur:PutReportDefinition`, `cur:DeleteReportDefinition`, or `cur:ModifyReportDefinition` has permissions to create, delete, or modify CUR files respectively. You can attach this IAM policy from the AWS documentation to any IAM user to grant them the necessary permissions.
Setting up the CUR – Step-By-Step
In the following procedure, we’ll walk through how to set up CUR files to be delivered to an S3 bucket in your account. The entire procedure is done from the AWS console.
1. Sign in to your AWS account, and navigate to the Billing and Cost Management console.
2. In the left menu bar, under Cost Analysis, select Data Exports (the legacy way to create a CUR can still be found under Legacy Pages, but we won’t be going over this older method).
3. Choose Create.
4. For Export type, choose Standard data export. We suggest this for just about all use cases, as it’s the most flexible option.
5. For Export name, enter a name for your report.
6. Under Data table content settings, make a few selections on what you want to include in your report. Here are some considerations to make:
- Under Additional export content, check the Include resource IDs box if you want information about your resource IDs in the report. This adds one more column to the CUR and can increase file size.
- Again under Additional export content, check the Split cost allocation data to include information about container-level costs and usage for ECS and EKS. This is a lot more granular than the default, which covers just instance-level costs. Checking this box adds 11 more columns to the output CUR and can greatly increase file size.
- For Time granularity, choose how you want your costs to be aggregated by: Hourly, Daily, or Monthly. For example, if you choose Hourly, you’ll only have one row for each line item per hour. We recommend choosing Hourly.
- For Column selection, uncheck any columns that you don’t want to include in the CUR. Luckily, the web interface provides a short description of each column next to its name, so use this to determine whether a column is worth keeping. If you’re unsure, we recommend keeping the column just in case.
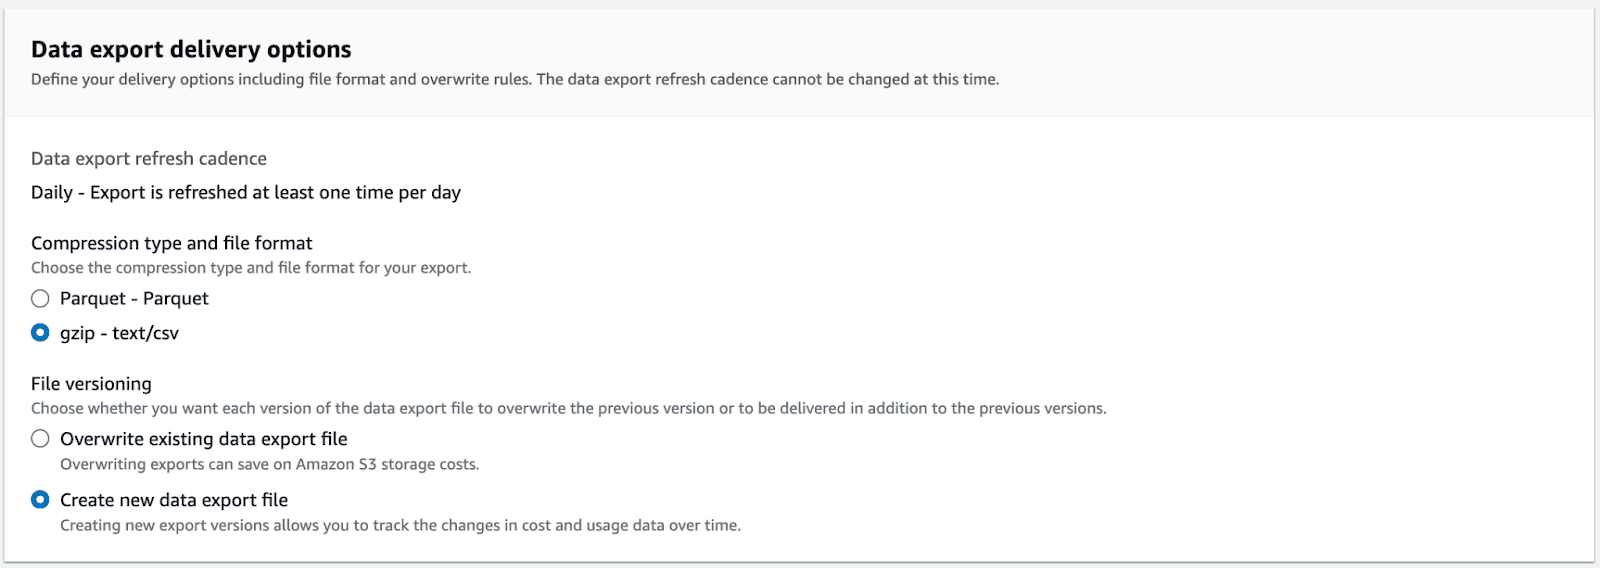
7. Under Data export delivery options, choose the desired file format. If you intend to analyze your report in Athena, choose Parquet. Otherwise, choose gzip.
8. Also under Data export delivery options, choose the desired file versioning behavior. If you choose Overwrite existing data export file, AWS overwrites the previous CUR file with each update. If you choose Create new data export file, AWS will deliver a separate CUR on each update. We recommend choosing Create new data export file.
9. Under Data export storage settings, choose where you want AWS to store your reports in S3:
- For S3 bucket, choose Configure. In the pop-up menu, choose either an existing bucket or create a new bucket. If you choose an existing bucket, you’ll also need to check the box acknowledging that your S3 bucket policy will be overwritten. Choose Select bucket.
- For S3 path prefix, enter the report path prefix that will be prepended to the name of your report.
10. Choose Create. You’re done!
On the next screen, you should see a confirmation at the top. It’ll say that all you have to do now is twiddle your thumbs for up to 24 hours:
![]()
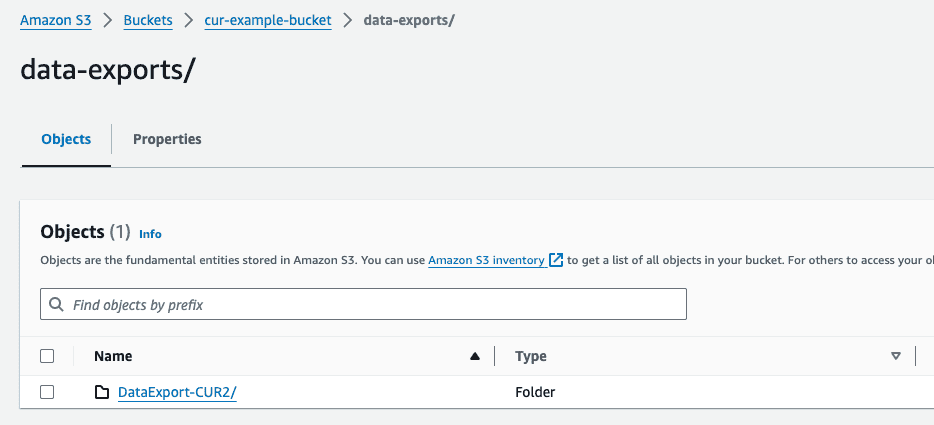
Soon enough, if you check your S3 bucket, you should see a sparkling new set of Data Export CUR files waiting for you (in the below screenshot, all Data Export files are under the data-exports prefix):
AWS Cost and Usage Reports vs. Data Exports
Data Exports are essentially the latest and greatest “version” of Cost and Usage Reports. You might also see Data Exports referred to as the “CUR 2.0”. However, to get technically precise, CUR 2.0 is the underlying table schema; Data Exports is a feature customers can use to create their own tables that use the CUR 2.0 schema.
Unlike older versions of the CUR, the biggest benefit of Data Exports is that you can select the columns appearing in your export. This can help you trim off any data you don’t need, and reduce the overall size of your CUR tables.
AWS Cost and Usage Reports vs. Cost Explorer
We’ve mentioned AWS Cost Explorer (CE) a number of times so far, so let’s discuss the similarities and differences between CE and the CUR.
Both CE and CUR are tools that help you understand spend and usage. However, you might call CE a “lightweight” tool and the CUR a “heavyweight” tool. This is because the CUR focuses a lot more on all the peculiar details of your billing. After all, data in the CUR is organized in many columns, and thus intended to be consumed by other “heavyweight” tools like Athena for analysis.
Cost Explorer is more high-level, and is more intended as a tool for visualizing your spend. If you like seeing cool graphs and charts and don’t need more advanced analysis that the CUR enables you to do, the CE is an excellent tool.
One very important thing to consider is that CE only lets you see spending data from the past 12 months. To retain spending history longer than that, you must use the CUR.
AWS Cost and Usage Reports vs. the Detailed Billing Report
The Detailed Billing Report (DBR) is a legacy feature that’s no longer supported for new customers as of July 2019. So, as of the Data Exports launch in November 2023, the DBR is older than old. Anyway, much of the information in a DBR is the same as the CUR, but the latest CUR 2.0 (Data Exports) is the shiny new thing that you should migrate to as soon as you can. You can migrate from DBR to CUR using this guide, and then from CUR to CUR 2.0 using this guide.
Nuances, Limitations, and Shortcomings of the CUR
So far, we’ve established that if you’re an AWS customer, you should probably set up the CUR sooner rather than later. However, we’ve also hinted at some of the CUR’s flaws. After all, the CUR is far from a perfect tool!
That’s why before you start working with the CUR, you’ll want to be aware of its various nuances, limitations, and shortcomings. Here are some of the major ones:
- The CUR in its native form is unreadable
- Requires an analytics tool to parse and interpret data
- Learning curve for CUR-specific structure and terminology
- CUR updates can be inconsistent
- CUR features and documentation can be misaligned
- You must opt into the CUR to get detailed data
We’ll take a closer look at each one in turn.
Unreadable in Native Form
While the CUR is essentially just a database table, it’s a really big database table. In the words of the AWS documentation: “The size of an individual report can grow to more than a gigabyte and might exceed the capacity of a desktop spreadsheet
applications to display every line.” Indeed, as we saw in an earlier screenshot of the CUR, it’s not something you’d want to view in Excel.
Why is this? A single Cost and Usage report can have over a hundred columns, and that’s with the default settings. If you use extensive tagging on your resources, the number of columns becomes effectively unlimited.
Yes, you can use Data Exports to deselect a lot of unnecessary columns. However, most enterprise-level CURs will still be too big to read as is. For example, if you choose the hourly time granularity, AWS generates one row per hour for each resource. Given this, it’s easy to see why CUR files, even for small and mid-sized organizations, can easily surpass the 1 million lines per file limit. When this happens, your CUR will be split into multiple files.
And finally, even if CUR files were manageable in size, their column names and data values can be very difficult to understand. Unless you’re well-versed in CUR-speak, it’s hard to decipher what the column “lineItem/UsageType” refers to, especially when possible values include the ever-cryptic “USE1-EUC1-AWS-Out-Bytes”, “APN2-FreeEventsRecorded”, and “Requests-Tier1”.

Requires an Analytics Tool
To handle a beast like the CUR, a data analytics tool is a must. The AWS CUR offers native integrations with Athena, Redshift, and QuickSight.
Despite the powerful capabilities of these tools, utilizing them effectively requires some technical know-how. For example, a DevOps team might struggle to handle a CUR or Data Export file without prerequisite SQL skills. Ensure that someone on your team is proficient in SQL is essential if you plan to do anything useful with the CUR, such as analyze them in Athena or Redshift.
As an additional hidden nuance, switching between native integrations, if you choose to do so, can be quirky. There are slight differences in the way Athena and Redshift format CUR columns. Changing the analytics tool you use might mean editing your SQL queries to ensure they still work.
Learning Curve
The first two points highlight an overarching theme when adopting the CUR: there can be a significant learning curve. This applies to both understanding the complex columns and format of the CUR, as well as becoming fluent in the analytics tool you choose.
Just consider some of the CUR billing terminology: one topic that newer AWS users often get tangled up is the difference between “unblended” versus “blended” costs:
- Unblended costs represent actual, real-time costs: if you spend $1/day on EC2 in an account, your unblended cost is $1/day.
- Blended costs represent average costs across accounts in an organization: if your organization spends $1/day on EC2 in account A, and $5/day on EC2 in account B, the blended cost for both accounts is $3/day (the unblended cost for account A is still $1/day, and $5/day for account B).
- Apart from these two, you also have amortized costs, which distribute recurring charges evenly across a more reasonable timeframe. For example, if you’re charged monthly for AWS EC2 Reserved Instances, it often helps to view amortized costs to distribute that charge evenly across each day so you don’t see a spike in billing at the start of each month.
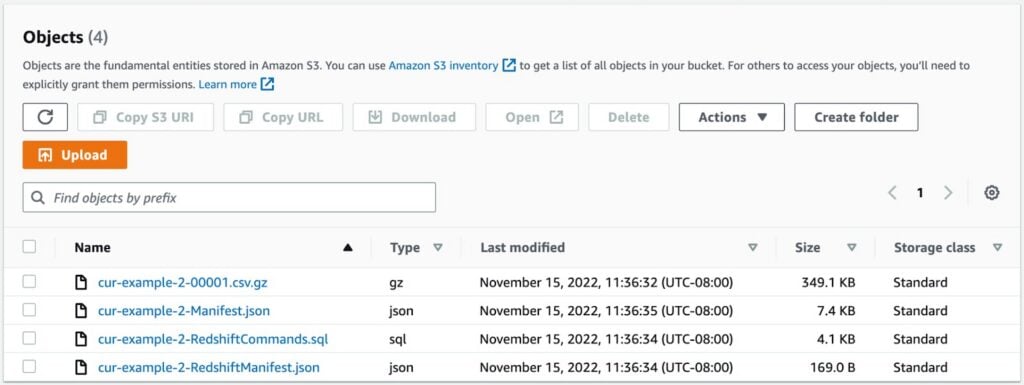
But apart from terminology, there’s also the file structure that you have to get used to, which varies based on the integration you choose. For example, with a Redshift integration, you’d get a CSV file, a Manifest JSON file, a SQL command to create a Redshift table, and a Redshift Manifest JSON file. The Manifest JSON file contains metadata about the CUR, such as a description of the columns, the report ID, and billing period.
All this to say, the CUR isn’t the most intuitive tool in the world. Expect to devote some time to learning how to use it.
Inconsistent CUR Updates
Every day, AWS updates your CUR file for costs incurred the day before (in UTC). At most, updates happen 3 to 4 times a day at regular intervals every 6 to 8 hours. In reality however, AWS can be very inconsistent in delivering timely updates. For example, CUR updates are most commonly delayed near the beginning and end of months, without much explanation from AWS as to why this is.
Reporting at the end of the month can also be tricky to navigate since AWS often makes retroactive updates to last month’s reports in addition to updating the current month’s reports. For example, if you have an enterprise discount, AWS may apply it to your report at the end of a monthly billing cycle. This means that AWS will update last month’s report to include discount details, which can be easy to miss.
For these reasons, we’d recommend that you avoid relying on AWS to deliver CUR updates on a timely basis. Instead, you might want to set up a system to consume CUR updates whenever they’re delivered, as suggested by AWS Well-Architectured Labs.
Misalignment Between CUR Features and Documentation
The data dictionary does a great job of explaining the columns you’ll find in your CUR file. However, it’s also prone to becoming outdated easily, especially since AWS periodically releases new fields and columns. In addition, just about any new AWS feature release could introduce new possible values or completely change the way something is reported. The data dictionary might be left to play catch-up.
In fact, the data dictionary acknowledges this in the intro: it describes only “a subset of columns that you see in your report”, so it may be possible that new columns aren’t immediately documented.
Must Opt in to Get Detailed Data
Perhaps the biggest shortcoming of the CUR is that despite all these other technical nuances and limitations, you’re still pretty much forced to opt into it. After all, it’s AWS’s only offering for receiving detailed spending data.
And not only are you forced to opt-in, but you should opt in ASAP. There’s no backfilling of past spending data with the CUR, so you’re missing out on a gold mine of data if you just sit idle. For instance, if you enable the CUR 3 years after opening your AWS account, that’s over 2 years of spending data that’s impossible to recover. While AWS Cost Explorer does give you basic spending information over the past 12 months, this is nothing compared to the detailed data you get with the CUR.
AWS should be more forthright about enabling the CUR the moment you set up your account, but unfortunately, this isn’t the case. We absolutely recommend enabling the CUR as early as possible to start accumulating spending data in your buckets.
Exploring CUR Integrations and Advanced CUR Topics
Now that we’ve covered the basics of the CUR, how to set it up, and its various limitations, the logical next step is to explore different CUR integrations and other advanced topics. After all, this is how you’re going to squeeze the most value out of your CUR.
In this section, we’ll take a closer look at the following topics:
- Cost Analytics – Native CUR Integrations
- Deep Dive into CUR Columns
- Cost Allocation Tags
- CloudForecast.io
Cost Analytics – Native CUR Integrations
The data in your CUR is like an untapped gold mine: full of potential, but not particularly valuable until you extract and process it! This is where the CUR’s 3 native integrations come into play. By hooking up your CUR with Athena, Quicksight, or Redshift, you can gain more insights and create data visualizations, all from within the AWS ecosystem.
While this all sounds amazing, the CUR forces you to choose one of the three services to integrate with during the initial setup. While you can change this later on, it’s best to choose correctly the first time since the format of your CUR can differ based on which integration you pick. This can be extremely awkward for new CUR users that are unfamiliar with these services. If this is you, fear not because we’re now going to explore each of these integrations with Athena, Quicksight, and Redshift.
CUR Integration with Athena
Amazon Athena is a data querying service that’s great for large-scale use cases, CUR files included. Think of Athena as the “engine” you use to run SQL queries on columns in your CUR file. It’s completely serverless, you only pay for the queries that you run, and Athena is able to return results in seconds.
Note that Athena is only responsible for running your queries. This means that the results you get won’t immediately be useful from a data analytics perspective. You’ll probably have to build additional BI applications based on your query results. Still, because the types of SQL queries you can run are effectively boundless, a CUR integration with Athena is extremely flexible.
To get a sense of the types of queries you can run, head over to AWS Well-Architectured Labs for some inspiration. In particular, you can write queries that isolate costs related to EC2 usage, figure out which of your ELBs are idle, and track spend on serverless products only (useful for tracking serverless product adoption across teams), just to name a few. To get started with a CUR integration with Athena, refer to the AWS documentation.
Read more on this topic: Using AWS Athena With Cost and Usage Reports (CUR)
CUR Integration with Quicksight
Amazon Quicksight is a business intelligence service that focuses on helping you create visualizations and dashboards for your CUR data. When setting up the integration, all you need to do is upload your CUR manifest file into Quicksight, and all columns and data from that file will be available for creating custom charts and graphs.
Among the three integrations, Quicksight has the smallest learning curve. Unlike Athena, which requires domain knowledge of SQL, Quicksight features a drag-and-drop interface so anyone can use it to create professional-looking dashboards.
To see Quicksight in action, we turn again to AWS Well-Architectured Labs for inspiration. The lab walks you through creating a graph to visualize cost by account and product, and cost by line item description. AWS documentation on CUR integrations with Quicksight is sparse, so we recommend the lab for getting started.
Read more on this topic: Using Amazon QuickSight With Cost and Usage Reports (CUR)
CUR Integration with Redshift
Amazon Redshift is a data warehouse where you can store and analyze large-scale data. Since Redshift is a data warehouse, you’ll have to load in your data into your Redshift cluster first, as opposed to the Athena integration where you can query the CUR file directly in S3.
The advantage of Redshift is that it contains backend optimizations to make querying more efficient. This makes it a great choice if you plan on running frequent queries. At the same time, you’d probably incur higher charges using Redshift since it’s not serverless: you’ll need to pay for data storage in addition to compute.
Since Redshift also works with SQL queries, the examples from AWS Well-Architectured Labs for Athena also apply to Redshift. This is a great place to get started with a Redshift integration.
Read more on this topic: Using Amazon Redshift With Cost and Usage Reports (CUR)
Summary
Here’s a table summarizing the three integrations:
| Topic | Athena | Quicksight | Redshift |
| Service summary | Serverless, data querying service that supports SQL | Serverless, BI service for creating visualizations and dashboards | Non-serverless, data warehouse service |
| Main capability | Run queries on the CUR as-is (stored in S3) | Create data visualizations for CUR data | Run queries on CUR data loaded into Redshift cluster |
| When/why choose this service? | Good for SQL SMEs, lower cost, better choice for infrequent querying | Beginner-friendly option, good choice for generating graphs quickly | Good for SQL SMEs, higher cost, better choice for frequent querying |
Deep Dive into CUR Columns
Becoming fluent in CUR-speak is what distinguishes a CUR expert from a newbie. With so many columns in a CUR file, you’ll want to focus your attention on just the ones that are most important to you. For starters, this may include:
- LineItem/UsageStartDate – The start date of the usage period for the current line item.
- LineItem/UsageEndDate – The end date for the usage period for the current line item. Together with LineItem/UsageStartDate, these are crucial for writing SQL queries that focus on a particular time window.
- LineItem/UnblendedCost – The total cost for this line item charged based on direct usage.
- LineItem/BlendedCost – The averaged cost for this line item across all member accounts of an organization. Unblended vs. Blended costs is a common source of confusion among newer CUR users.
- LineItem/ResourceId – The resource ID. Only included if you enable individual resource IDs in your report. Each AWS service may refer to a different resource identifier, summarized in this table in the AWS documentation.
Of course, there are a wealth of other columns that might be crucial to you. Anything in the data dictionary is fair game! For example, if you’re on a Savings Plan, pay special attention to the savingsPlan/ columns.
AWS Cost Allocation Tags
Cost allocation tags are a special breed of tags. They help you categorize resources based on how you want them billed, which may or may not be the same as how you manage and organize them regularly (i.e. with plain-old resource tags). This is the main distinction between cost allocation tags and regular tags.
Your CUR file displays cost allocation tags only. Cost allocation tags come in two flavors: AWS-generated, and user-defined.
- There is just one AWS-generated tag: aws:createdBy, which contains information about who created the resource. Fields within this tag include account-type and account-id.
- User-defined tags are more interesting: you can create whatever tags you want that make the most sense in allocating your costs. Tags that you create have the user: prefix.
For both of these types of tags, you must activate them in order for them to start showing up in the CUR as resourceTags/ columns. Creating effective cost allocation tags can be a game-changer in helping you make the most sense of your costs.
CloudForecast.io
And finally, if you’re tired of all this CUR business, you may want to give CloudForecast a spin. Rather than having to sift through columns and run complex queries all day, CloudForecast provides a central cloud monitoring and cost optimization platform that makes tracking costs easy.
Remember all the downsides to the CUR that we covered in the last section? CloudForecast addresses these pain points with the following core features:
- Visual dashboards – Right out of the box, CloudForecast takes your CUR and produces easy-to-read visual spending reports out of it. Why interpret your CUR yourself when CloudForecast can do it for you?
- Cost anomaly detection – CloudForecast lets you view all your AWS resources in a central platform. For each resource, you can monitor the overall cost, usage, and performance, making it easy to detect anomalies early.
- Custom dashboards – CloudForecast generates a daily spending report highlighting the most important cost information, but what if you wanted more? Good news: you also get the ability to customize dashboards to share with your stakeholders.
Overall, CloudForecast can be an invaluable tool in helping your organization both understand your costs and figure out avenues for cost optimization.
Conclusion
Whew! We’ve just steamrolled through a lot of content on the CUR–props to you for making it through this far. Hopefully, this gave you a good overview of AWS Cost & Usage Reports, one of the most important offerings that many AWS users don’t use to their full potential.
In this article, we explored everything from the basics of CUR to its limitations. We provided a step-by-step guide on setting up the latest version of CUR Data Exports from the AWS console. Following that, we examined key CUR integrations and suggested advanced topics to dive into next.
Though we’re at the end of this article, your CUR journey should not and cannot end here. Remember that as your organization grows, so will your costs, so taking steps to proactively understand the CUR is crucial to do sooner rather than later. Or, feel free to delegate that piece to CloudForecast and they’ll make sure you’re in good hands.
Alexander Yu
Alexander Yu is a technical writer at AWS by day and a freelance writer by night. After completing his BS in electrical engineering and computer science from UC Berkeley, he became a software developer at AWS for almost three years before transitioning into technical writing. He lives in Seattle with his dog Yuna.
Blog
More from CloudForecast


Cloud Cost Management is Easy With CloudForecast
We would love to learn more about the problems you are facing around AWS and Azure cost. Connect with us directly and we’ll schedule a time to chat!
Start Free Trial