cAdvisor and Kubernetes Monitoring Guide

July 25, 2023
Guides
Kubernetes has solved many challenges, like speed, scalability, and resilience, but it’s also introduced a new set of difficulties when it comes to monitoring infrastructure. Application monitoring is already daunting enough when you’re not dealing with container orchestration tools like Kubernetes, so there’s definitely a need for a dedicated monitoring tool.
Enter cAdvisor, an open-source agent that monitors resource usage and analyzes the performances of containers. In this article, you’ll learn some of the challenges with monitoring in Kubernetes and how to use cAdvisor to address them.
⚓️⚓️⚓️ Check out our other Kubernetes guides:
- ECS vs EKS vs EC2 on AWS: Where Should You Deploy Your Containers?
- Kubernetes Cost Management and Analysis Guide
- Node Exporter and Kubernetes Guide
- Using Terraform to Deploy to EKS
Why Is Monitoring Important?
It’s hard to see what’s going on inside a Kubernetes container, and once the container dies, the data inside can never be recovered. You can’t even look at a log to see what’s wrong, which makes troubleshooting almost impossible.
Monitoring tools take all essential metrics and logs and store them in a safe, centralized location so you can access them at any point to troubleshoot any issue. Monitoring Kubernetes, therefore, gives you insight into the cluster’s health and performance metrics, resource count, and a top-level overview of what’s going inside your cluster. When an error occurs, a monitoring tool will alert you, so you can quickly roll out fixes.
Since Kubernetes sits in the intersection of bare metal or virtual infrastructure and the services that your apps run on, it’s essential to monitor its health.
cAdvisor Overview
cAdvisor analyzes metrics for memory, CPU, file, and network usage for all containers running on a given node. However, it doesn’t store this data long-term, so you need a dedicated monitoring tool.
Since cAdvisor is already integrated with the kubelet binary, there are no special steps required to install it. The only thing you need to ask yourself is, what metrics do you want to measure? cAdvisor collects a wide variety of metrics—take a look at the full list here.
But some key metrics are especially important to track no matter what you’re building. Here’s a look at some of them.
cAdvisor Metrics for CPU
container_cpu_load_average_10s: This measures the value of the container CPU load average over the last ten seconds.container_cpu_usage_seconds_total: This is the addition of cumulative “user” CPU time consumed and cumulative “system” CPU time consumed.
cAdvisor Metrics for Memory
container_memory_usage_bytes: This measures current memory usage. You can track this per container to get more insight into the process’s memory footprint in each container.container_memory_failcnt: This measures the number of times a container’s memory usage hits the maximum limit. It’s good practice to set container memory usage limits to prevent the memory-intensive task from essentially starving other containers on the same server.container_memory_cache: This measures the number of bytes of page cache memory.container_memory_max_usage_bytes: This metric gives the number of maximum memory usage in bytes.
cAdvisor Metrics for Disk
container_fs_io_time_seconds_total: This measures the cumulative count of seconds spent doing I/Os.container_fs_writes_bytes_total: This measures the cumulative count of bytes written.container_fs_read_bytes_total: This measures the cumulative count of bytes read.
cAdvisor Metrics for Network
container_network_receive_errors_total: This measures the cumulative count of errors encountered while receiving bytes over your network. Networking on containers can get tricky, so it’s important to keep an eye on failures.container_network_receive_bytes_total: This measures the cumulative count of bytes received over your network.container_network_transmit_bytes_total: This gives the cumulative count of bytes transmitted over your network.container_network_transmit_errors_total: This gives the cumulative count of errors that happened while transmitting. The network metrics help reduce the debugging efforts by keeping track of the total number of failures that occurred during transmission.

cAdvisor with Prometheus and Grafana
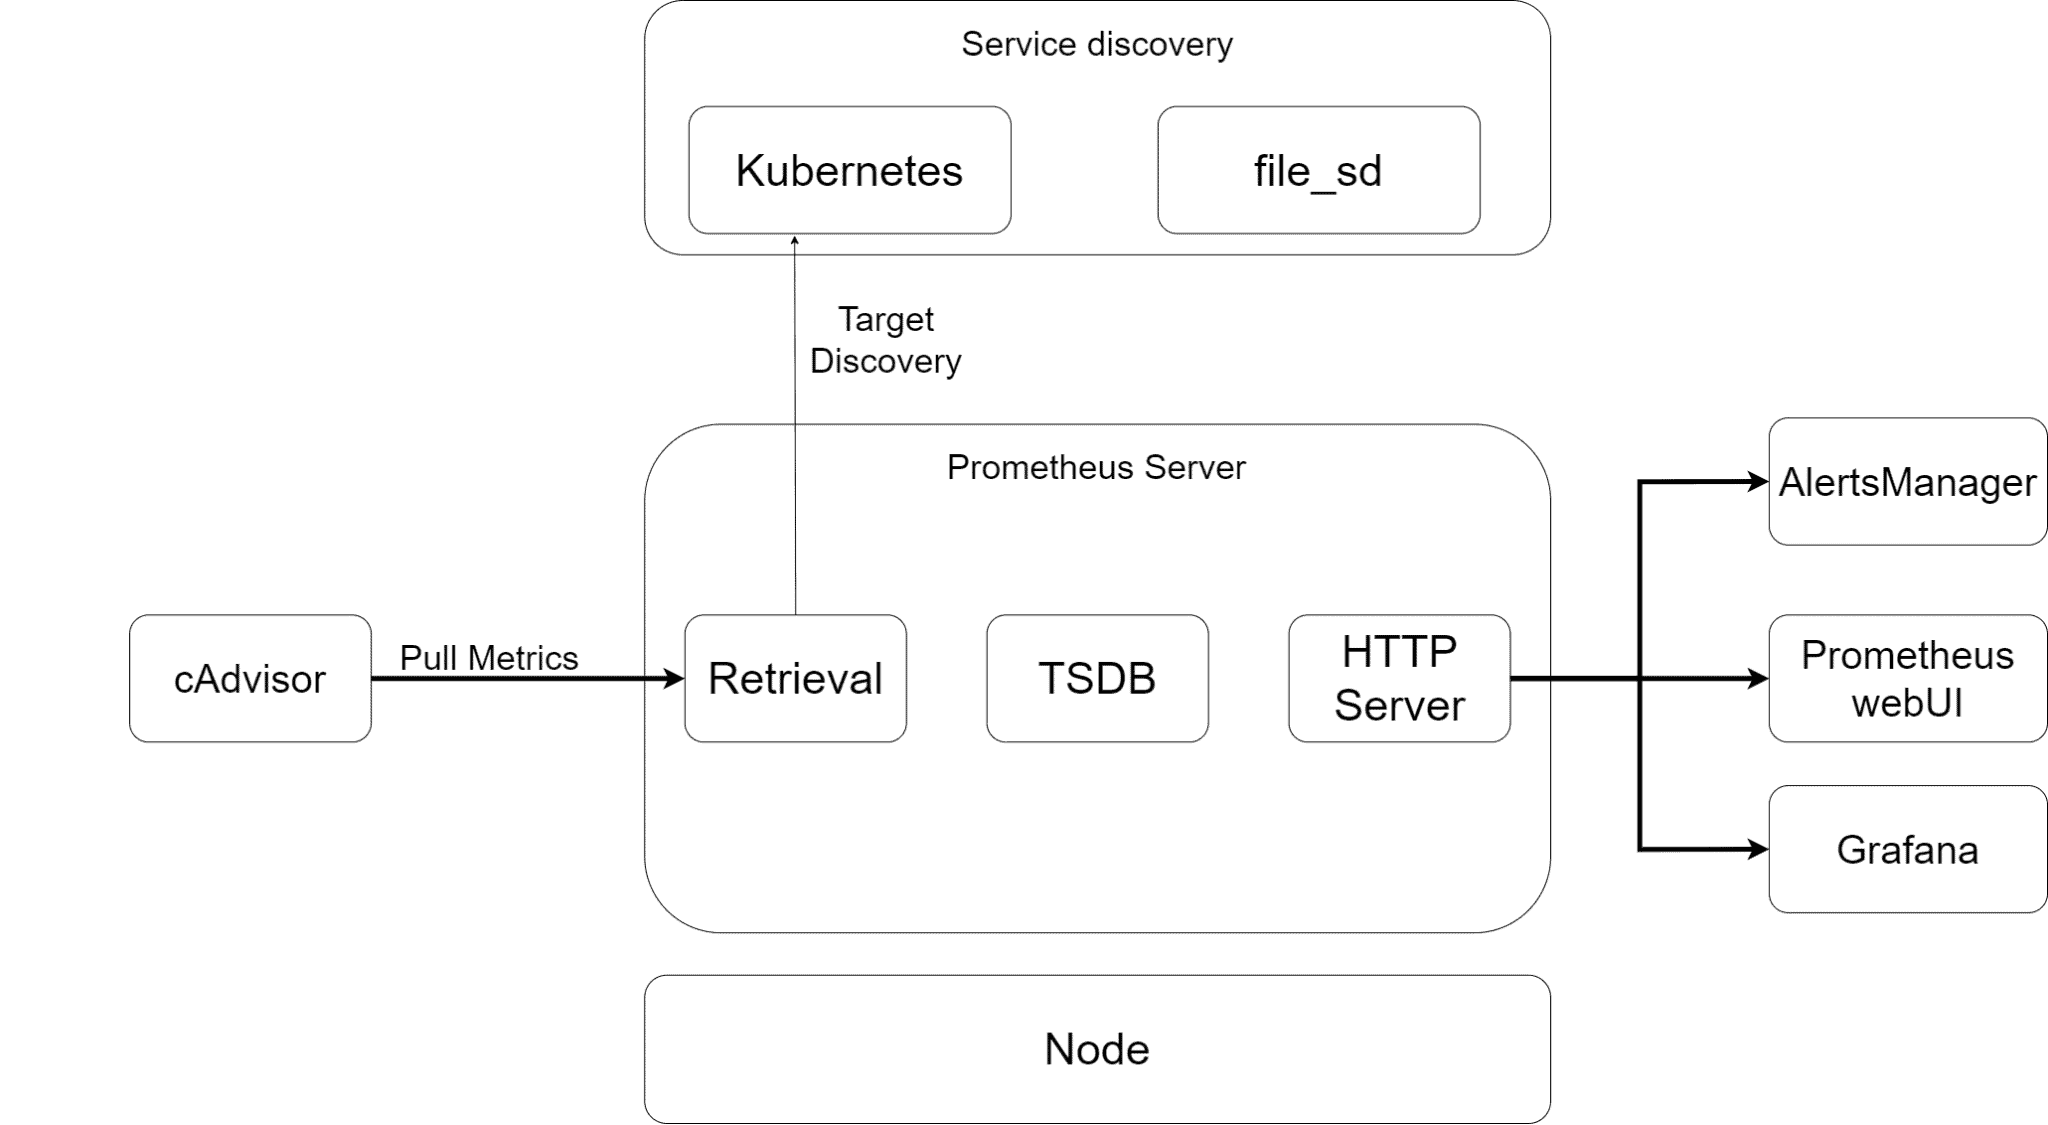
Prometheus is a metrics server that scrapes and stores metrics from different sources, including Kubernetes nodes and individual containers. Since you want to collect the metrics related to containers, you’ll be using cAdvisor in this example.
Grafana is a monitoring solution that will pull the stored metrics from Prometheus and display them on beautiful dashboards. You can create custom dashboards with different metrics and also set up alerts according to your application requirements.
Prometheus Setup
Now that we have a little understanding of how Prometheus fits into a Kubernetes monitoring system, let’s start with the setup.
Creating a Namespace and Cluster Role w/ Prometheus
The first step in setting up Prometheus is to create a namespace. If you didn’t, then all of the Prometheus Kubernetes deployment objects would get deployed onto the default namespace. You can use kubectl to create a namespace:
1 |
kubectl create namespace monitoring |
To create a cluster role, create a file name clusterRole.yml, paste in the following definition, and save the file:
1 2 3 4 5 6 7 8 9 10 11 12 13 14 15 16 17 18 19 20 21 22 23 24 25 26 27 28 29 30 31 32 33 |
apiVersion: rbac.authorization.k8s.io/v1 kind: ClusterRole metadata: name: prometheus rules: - apiGroups: [""] resources: - nodes - nodes/proxy - services - endpoints - pods verbs: ["get", "list", "watch"] - apiGroups: - extensions resources: - ingresses verbs: ["get", "list", "watch"] - nonResourceURLs: ["/metrics"] verbs: ["get"] --- apiVersion: rbac.authorization.k8s.io/v1 kind: ClusterRoleBinding metadata: name: prometheus roleRef: apiGroup: rbac.authorization.k8s.io kind: ClusterRole name: prometheus subjects: - kind: ServiceAccount name: default namespace: monitoring |
Apply the clusterRole using:
1 |
kubectl apply -f clusterRole.yml |
Prometheus Configmap Creation
You need a configmap for all of Prometheus’s configurations and alert rules. This is a crucial step since you’ll put the configuration related to cAdvisor and other jobs like Node Exporter in this file.
Create a file named config-map.yml and paste in the following code:
1 2 3 4 5 6 7 8 9 10 11 12 13 14 15 16 17 18 19 20 21 22 23 24 25 26 27 28 29 30 31 32 33 34 35 36 37 38 39 40 41 42 43 44 45 46 47 48 49 50 51 52 53 54 55 56 57 58 59 60 61 62 63 64 65 66 67 68 69 70 71 |
apiVersion: v1
kind: ConfigMap
metadata:
  name: prometheus-server-conf
  labels:
    name: prometheus-server-conf
  namespace: monitoring
data:
  prometheus.rules: |-
    groups:
    - name: devopscube demo alert
      rules:
      - alert: High Pod Memory
        expr: sum(container_memory_usage_bytes) > 1
        for: 1m
        labels:
          severity: slack
        annotations:
          summary: High Memory Usage
  prometheus.yml: |-
    global:
      scrape_interval: 5s
      evaluation_interval: 5s
    rule_files:
      - /etc/prometheus/prometheus.rules
    alerting:
      alertmanagers:
      - scheme: http
        static_configs:
        - targets:
          - "alertmanager.monitoring.svc:9093"

    scrape_configs:
      - job_name: kubernetes-nodes-cadvisor
        scrape_interval: 10s
        scrape_timeout: 10s
        scheme: https  # remove if you want to scrape metrics on insecure port
        tls_config:
          ca_file: /var/run/secrets/kubernetes.io/serviceaccount/ca.crt
        bearer_token_file: /var/run/secrets/kubernetes.io/serviceaccount/token
        kubernetes_sd_configs:
          - role: node
        relabel_configs:
          - action: labelmap
            regex: __meta_kubernetes_node_label_(.+)
          # Only for Kubernetes ^1.7.3.
          # See: https://github.com/prometheus/prometheus/issues/2916
          - target_label: __address__
            replacement: kubernetes.default.svc:443
          - source_labels: [__meta_kubernetes_node_name]
            regex: (.+)
            target_label: __metrics_path__
            replacement: /api/v1/nodes/${1}/proxy/metrics/cadvisor
        metric_relabel_configs:
          - action: replace
            source_labels: [id]
            regex: '^/machine.slice/machine-rktx2d([^]+).+/([^/]+).service
|
Apply the config-map using:
1 |
kubectl apply -f config-map.yml |
This will create two files inside the container, one containing configurations to discover pods and running services in Kubernetes, and one containing the alert rules for sending alerts to the alert manager.
Creating Deployment Set
Create a prometheus-deployment.yml, copy the following content in the file, and save it:
1 2 3 4 5 6 7 8 9 10 11 12 13 14 15 16 17 18 19 20 21 22 23 24 25 26 27 28 29 30 31 32 33 34 35 36 37 38 39 40 41 42 43 44 45 46 |
apiVersion: apps/v1
kind: Deployment
metadata:
  name: prometheus-deployment
  namespace: monitoring
  labels:
    app: prometheus-server
spec:
  replicas: 1
  selector:
    matchLabels:
      app: prometheus-server
  template:
    metadata:
      labels:
        app: prometheus-server
    spec:
      containers:
        - name: prometheus
          image: prom/prometheus
          args:
            - "--storage.tsdb.retention.time=12h"
            - "--config.file=/etc/prometheus/prometheus.yml"
            - "--storage.tsdb.path=/prometheus/"
          ports:
            - containerPort: 9090
          resources:
            requests:
              cpu: 500m
              memory: 500M
            limits:
              cpu: 1
              memory: 1Gi
          volumeMounts:
            - name: prometheus-config-volume
              mountPath: /etc/prometheus/
            - name: prometheus-storage-volume
              mountPath: /prometheus/
      volumes:
        - name: prometheus-config-volume
          configMap:
            defaultMode: 420
            name: prometheus-server-conf

        - name: prometheus-storage-volume
          emptyDir: {}
|
Create the deployment using:
1 |
kubectl apply -f prometheus-deployment.yml |
You can check if the deployment is up or not using:
1 |
kubectl get deployments –n monitoring |
Prometheus UI Access
To access the Prometheus dashboard from your browser, you need to create a service. Go ahead and create prometheus-service.yml and paste in the following content:
1 2 3 4 5 6 7 8 9 10 11 12 13 14 15 16 |
apiVersion: v1
kind: Service
metadata:
  name: prometheus-service
  namespace: monitoring
  annotations:
      prometheus.io/scrape: 'true'
      prometheus.io/port:   '9090'
spec:
  selector:
    app: prometheus-server
  type: NodePort
  ports:
    - port: 8080
      targetPort: 9090
      nodePort: 30000
|
Create a service for Prometheus deployment using:
1 |
kubectl apply -f prometheus-service.yml |
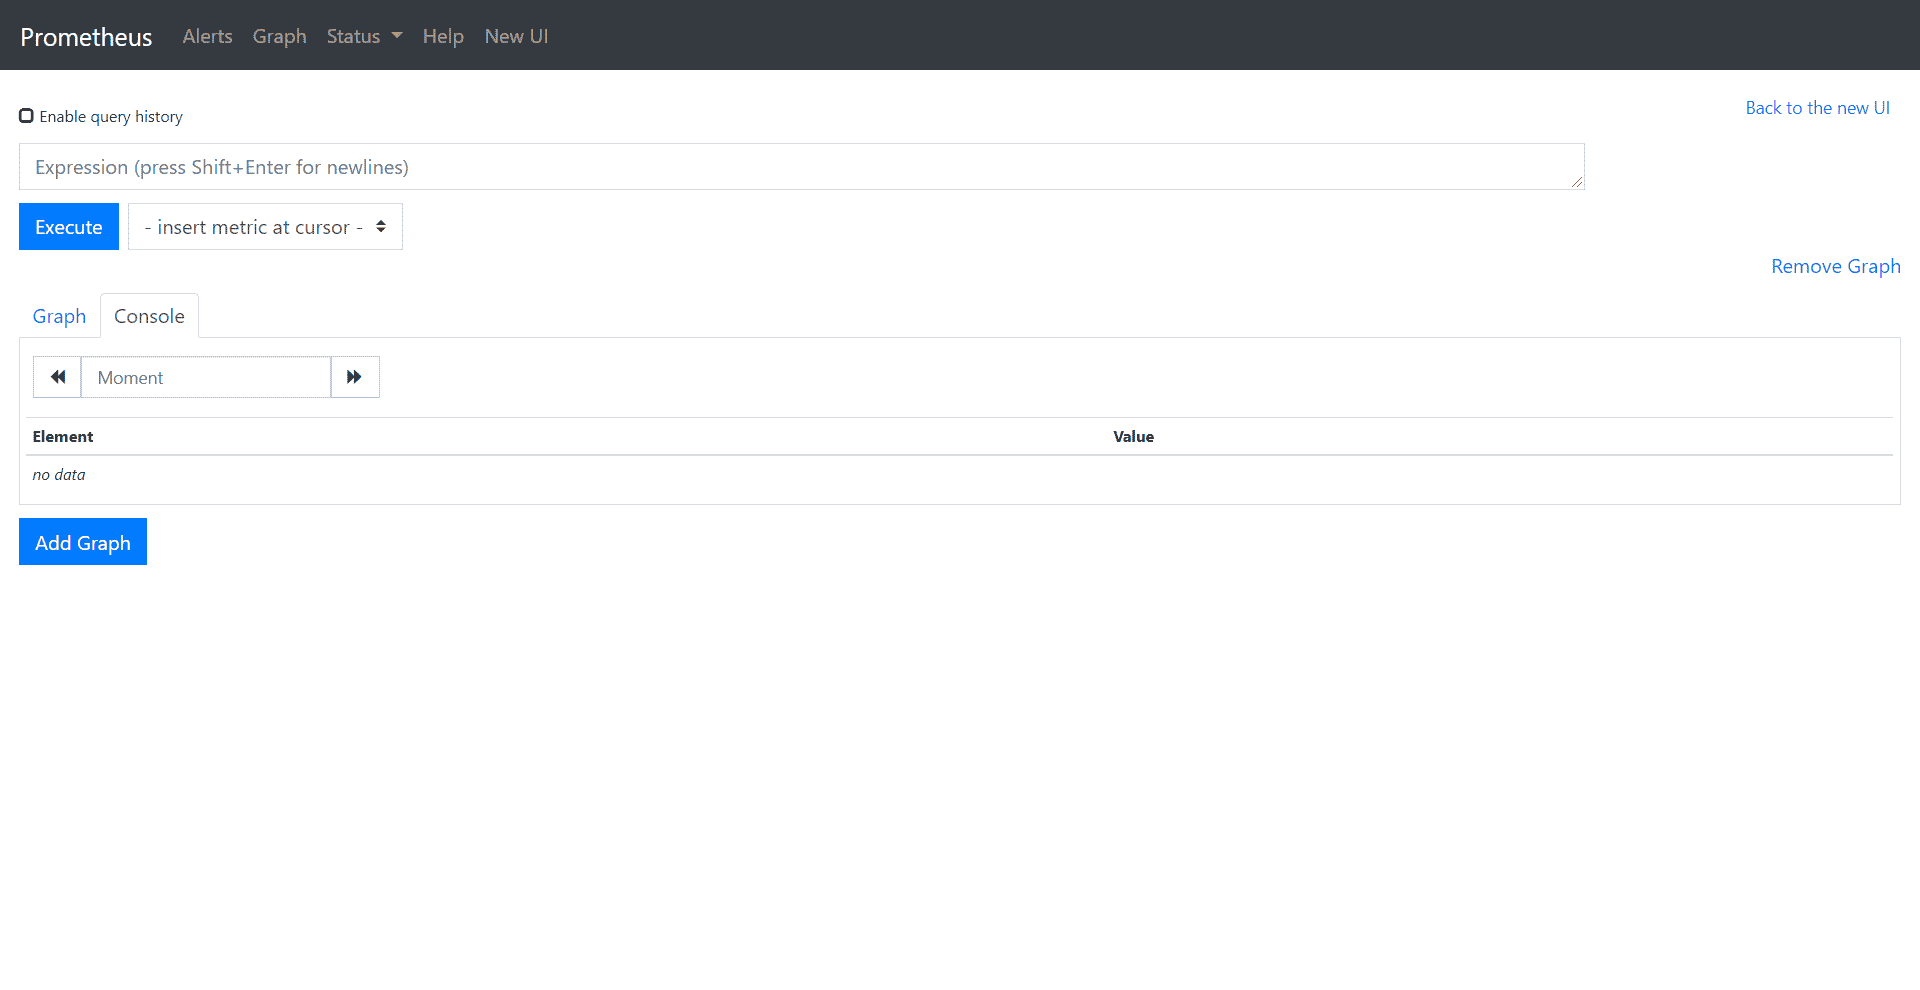
Now, if you open the IP of your Kubernetes node on port 30000, you can view the Prometheus dashboard.
Grafana Setup
You’ll need to create a data source configuration for Prometheus so that Grafana can collect scraped data from Prometheus. So make a file name grafana-datasource-config.yml and paste in the following content:
1 2 3 4 5 6 7 8 9 10 11 12 13 14 15 16 17 18 19 20 21 |
apiVersion: v1
kind: ConfigMap
metadata:
  name: grafana-datasources
  namespace: monitoring
data:
  prometheus.yaml: |-
    {
        "apiVersion": 1,
        "datasources": [
            {
               "access":"proxy",
                "editable": true,
                "name": "prometheus",
                "orgId": 1,
                "type": "prometheus",
                "url": "https://prometheus-service.monitoring.svc:8080",
                "version": 1
            }
        ]
    }
|
Apply this config using:
1 |
kubectl apply -f grafana-datasource-config.yaml |
Grafana Deployment Setup
Create a file named grafana-deployment.yml and paste in the following content:
1 2 3 4 5 6 7 8 9 10 11 12 13 14 15 16 17 18 19 20 21 22 23 24 25 26 27 28 29 30 31 32 33 34 35 36 37 38 39 40 41 42 |
apiVersion: apps/v1
kind: Deployment
metadata:
  name: grafana
  namespace: monitoring
spec:
  replicas: 1
  selector:
    matchLabels:
      app: grafana
  template:
    metadata:
      name: grafana
      labels:
        app: grafana
    spec:
      containers:
      - name: grafana
        image: grafana/grafana:latest
        ports:
        - name: grafana
          containerPort: 3000
        resources:
          limits:
            memory: "1Gi"
            cpu: "1000m"
          requests:
            memory: 500M
            cpu: "500m"
        volumeMounts:
          - mountPath: /var/lib/grafana
            name: grafana-storage
          - mountPath: /etc/grafana/provisioning/datasources
            name: grafana-datasources
            readOnly: false
      volumes:
        - name: grafana-storage
          emptyDir: {}
        - name: grafana-datasources
          configMap:
              defaultMode: 420
              name: grafana-datasources
|
Create the deployment using:
1 |
kubectl apply -f grafana-deployment.yml |
Grafana Dashboard Access
Now to access the Grafana dashboard, you need to expose the service to a particular port. Create a file named grafana-service.yml.
1 2 3 4 5 6 7 8 9 10 11 12 13 14 15 16 |
apiVersion: v1
kind: Service
metadata:
  name: grafana
  namespace: monitoring
  annotations:
      prometheus.io/scrape: 'true'
      prometheus.io/port:   '3000'
spec:
  selector:
    app: grafana
  type: NodePort
  ports:
    - port: 3000
      targetPort: 3000
      nodePort: 32000
|
Create this service using:
1 |
kubectl apply -f grafana-service.yml |
Now, if you open the IP of your Kubernetes node on port 32000, you can view the Grafana dashboard.
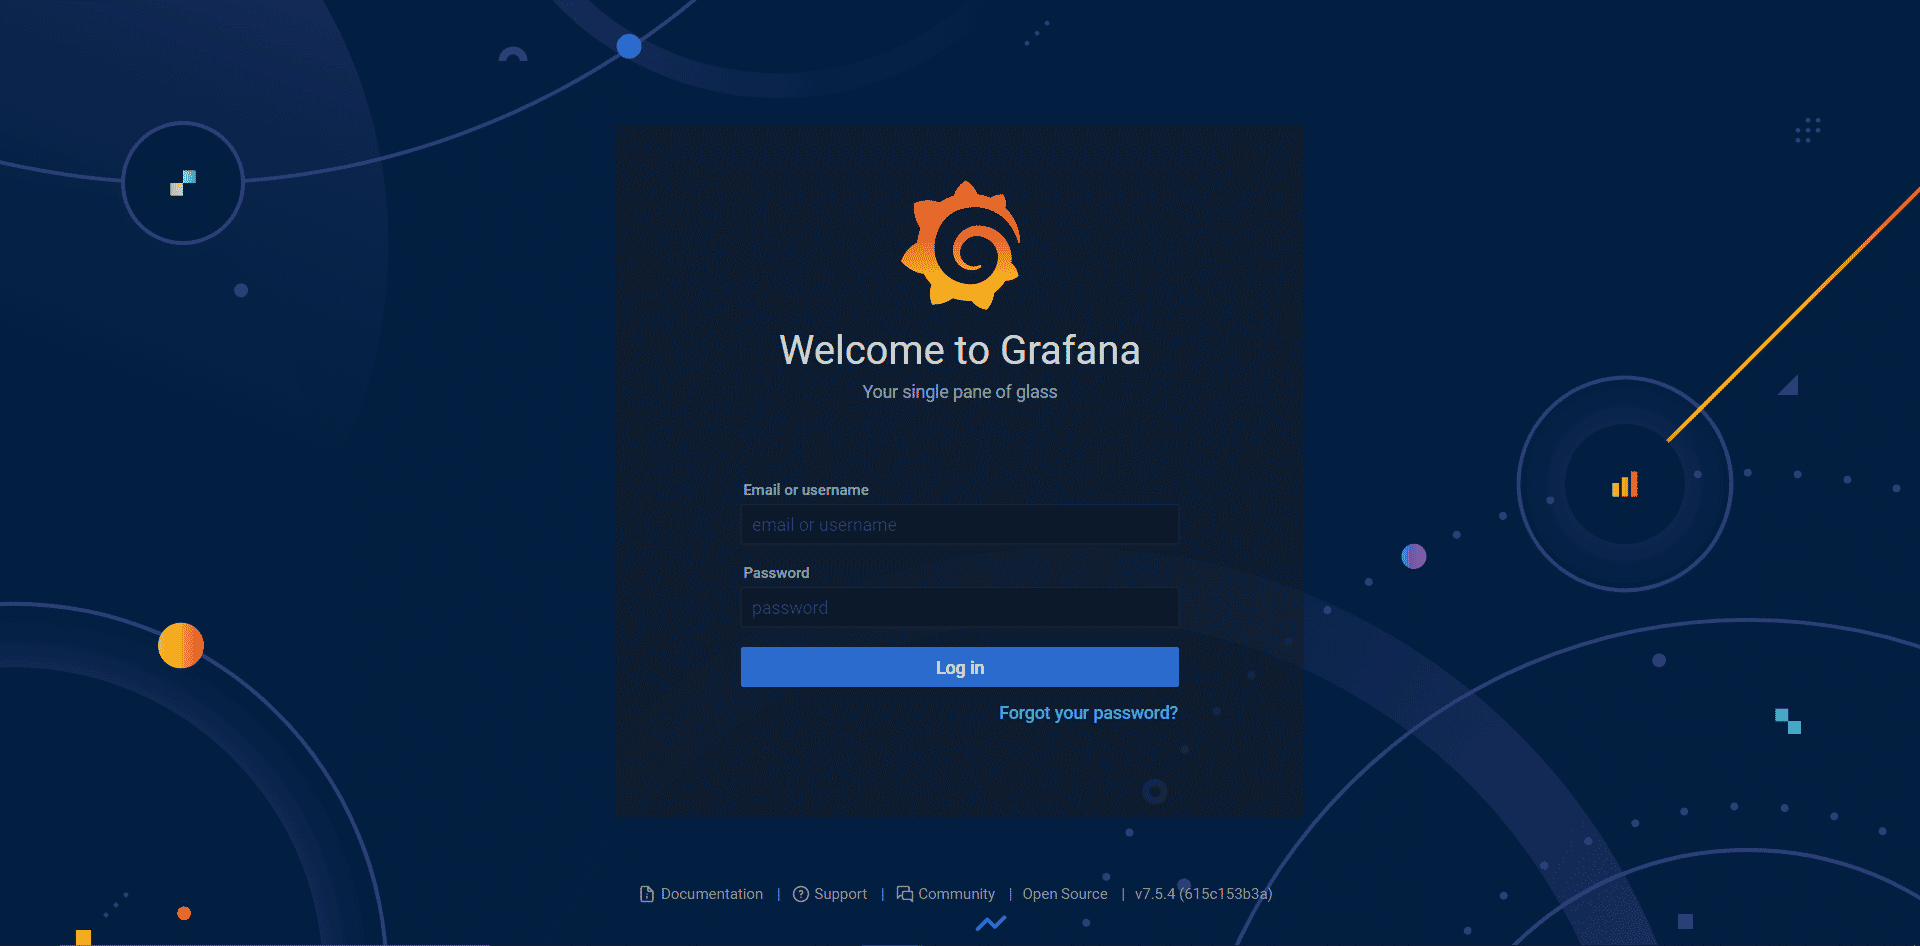
Log in to the dashboard using the default credentials:
1 2 |
User: admin Pass: admin |
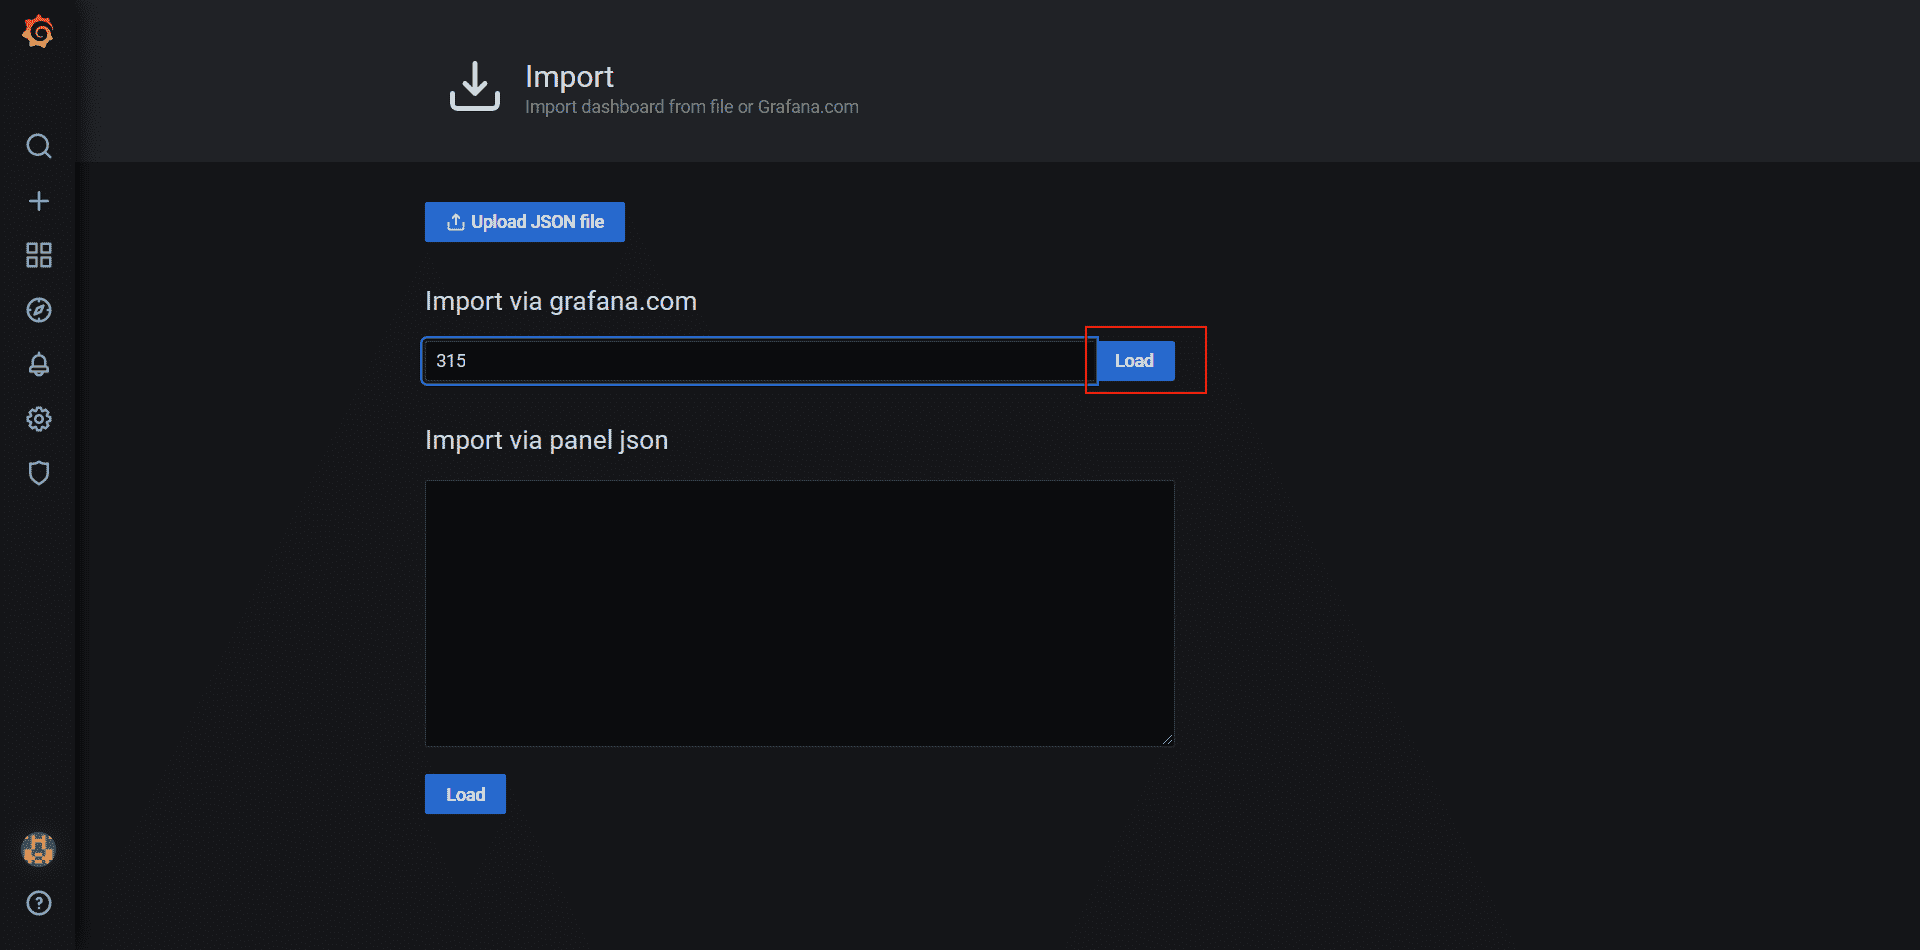
Grafana Dashboards Creation
After you log in, select Import on the navigation bar on the left. Enter 315 as the code and load it in.
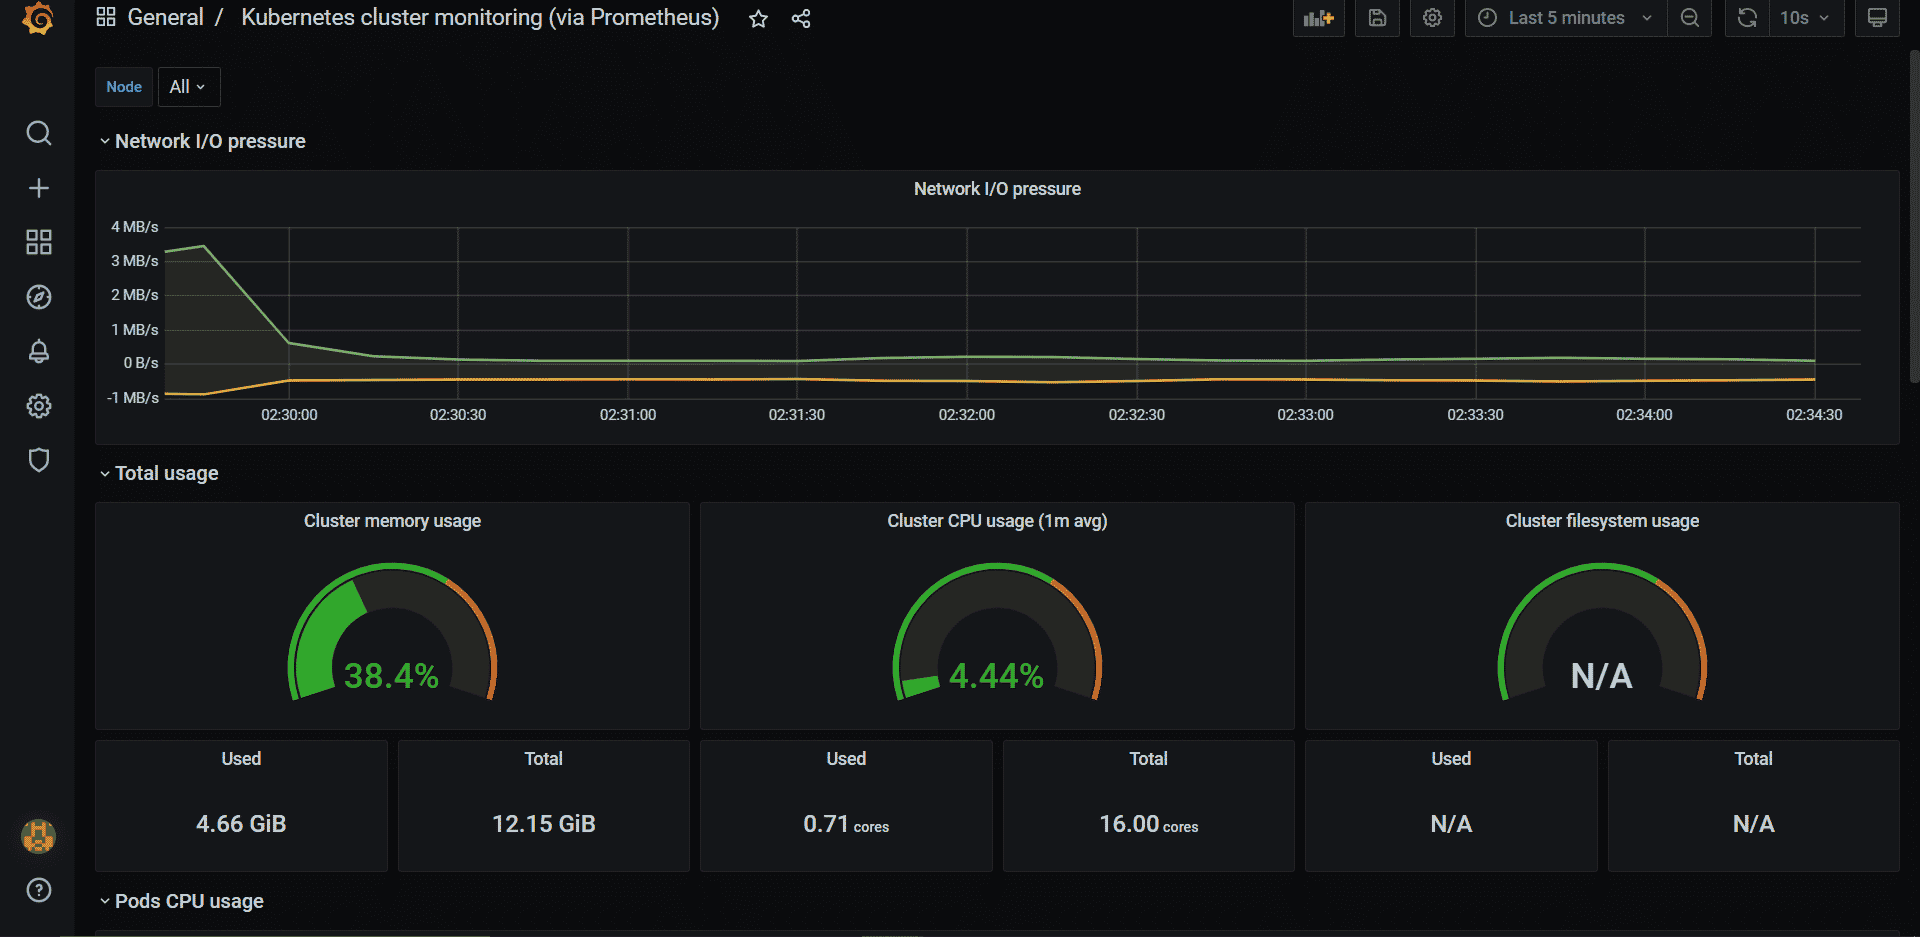
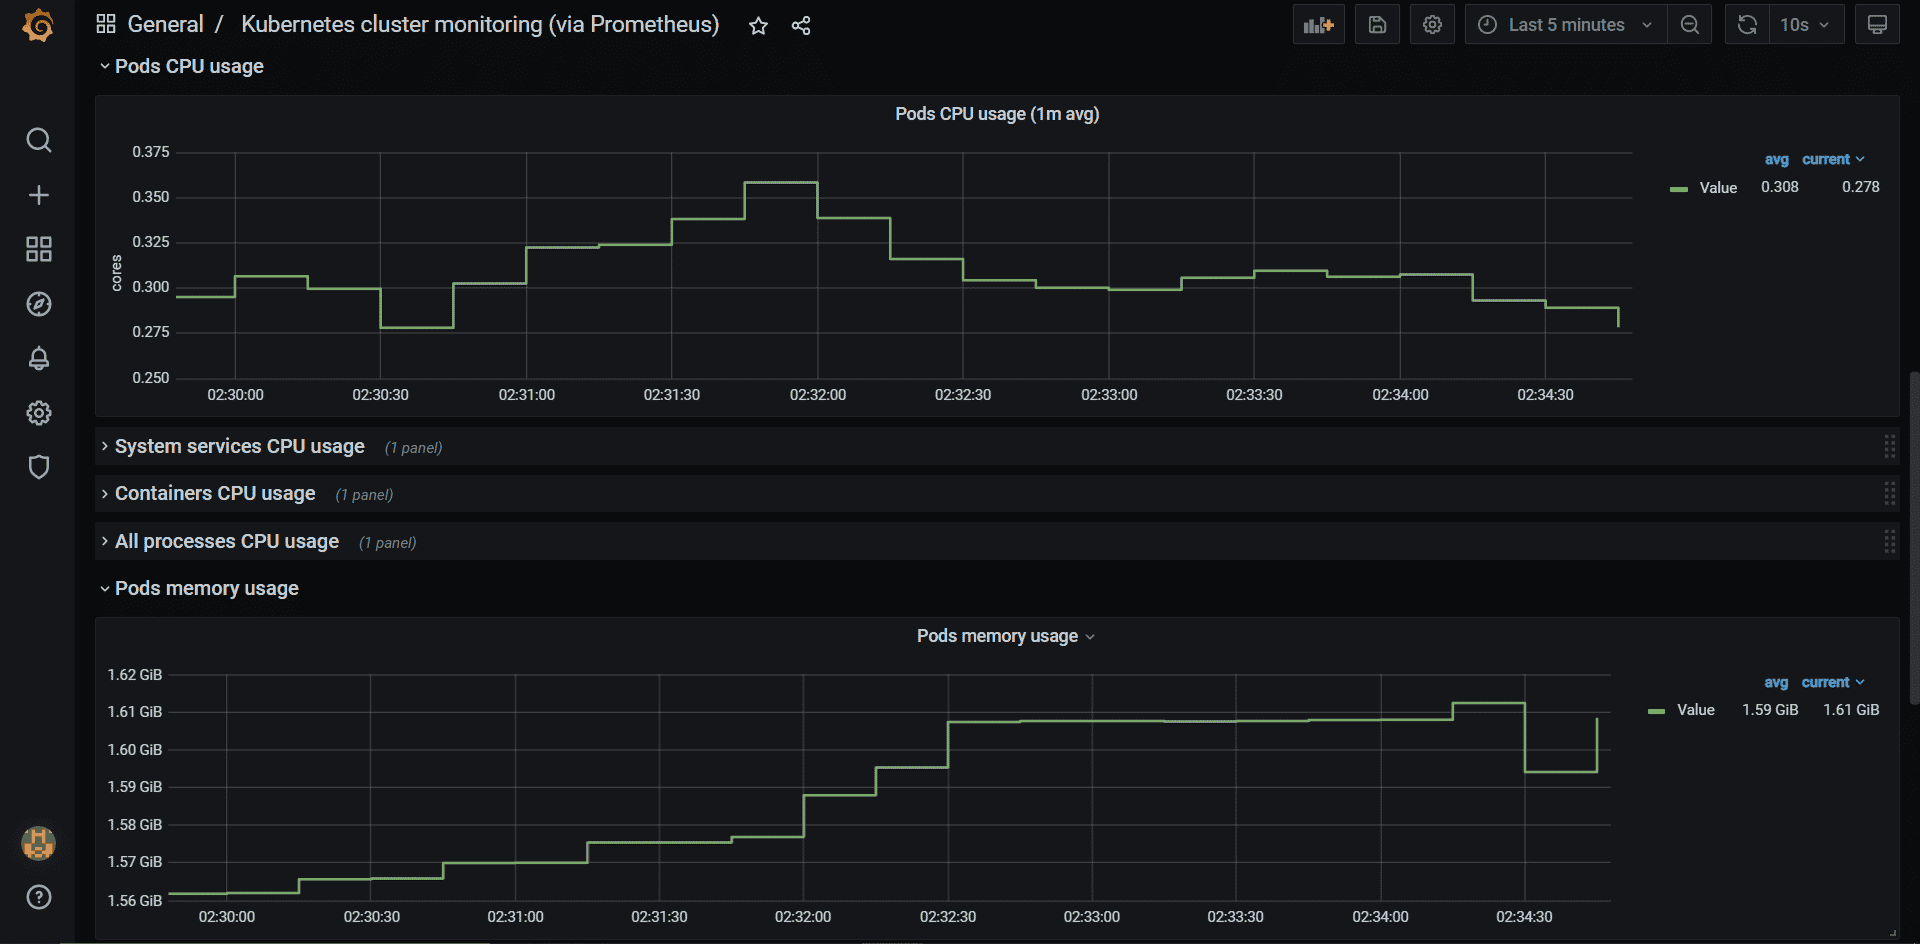
On the next screen, give your dashboard a name and select prometheus as a data source. Click Import.
This template will automatically retrieve the key metrics from cAdvisor and show you the stats You can also add different metrics to this dashboard or create an entirely new dashboard from scratch.
Conclusion
Now you should have a basic understanding of why monitoring in Kubernetes is important, the difficulties related to it, and how you can use cAdvisor to address it. You also learned a bit about some of the key metrics you should be monitoring in every project, and how to set up Prometheus and Grafana with cAdvisor.
It can be a tedious task to monitor and manage the cost of your Kubernetes cluster, but it’s vital to understanding what’s going on. If you need help with cost management for Kubernetes, check out CloudForecast. We’ll be offering a new way to manage your Kubernetes, EKS, and ECS costs very soon.
Another k8s monitoring tool that might be worth looking at is our friends at ContainIQ. Their platform makes it easy for teams to monitor core metrics and track events as they happen. The out-of-the-box solution allows you to monitor the health of your cluster with pre-built dashboards and easy-to-set alerts. It just works with a one-line install.
target_label: rkt_container_name
replacement: ‘${2}-${1}’
– action: replace
source_labels: [id]
regex: ‘^/system.slice/(.+).service
Vivek Sonar
Vivek is a full-stack engineer who loves to solve complex infrastructure problems and work with public cloud platforms like AWS and GCP.
Blog
More from CloudForecast


Cloud Cost Management is Easy With CloudForecast
We would love to learn more about the problems you are facing around AWS and Azure cost. Connect with us directly and we’ll schedule a time to chat!
Start Free Trial