Node Exporter and Kubernetes Guide

July 26, 2023
Guides
Monitoring is essential to a reliable system. It helps keep your services consistent and available by preemptively alerting you to important issues. In legacy (non-Kubernetes) systems, monitoring is simple. You only need to set up dashboards and alerts on two components: the application and the host. But when it comes to Kubernetes, monitoring is significantly more challenging.
In this guide, we explore the challenges associated with Kubernetes monitoring, how to set up a monitoring and alert system for your Kubernetes clusters using Grafana and Prometheus, a pricing comparison of four different hosted monitoring systems, and some key metrics that you can set up as alerts in your system.
⚓️⚓️⚓️ Check out our other Kubernetes guides:
- cAdvisor and Kubernetes Monitoring Guide
- ECS vs EKS vs EC2 on AWS: Where Should You Deploy Your Containers?
- Kubernetes Cost Management and Analysis Guide
- Using Terraform to Deploy to EKS
How Is Kubernetes Monitoring Different From Traditional Systems?
Kubernetes is highly distributed, being composed of several different nested components. You need to monitor your application and hosts, as well as your containers and clusters. Kubernetes also has an additional layer of complexity—automated scheduling.
The scheduler manages your workloads and resources optimally, creating a moving target. As the architect, you can’t be certain of the identity or number of nodes running on your pods. You can either manually schedule your nodes (not recommended) or deploy a robust tagging system alongside logging. Tagging allows you to collect information from your clusters, which exposes the metrics to an endpoint for a service to scrape.
What Is a Node Exporter by Prometheus
The most popular service that tags and exports metrics in Kubernetes is Node Exporter by Prometheus, an open source service that installs through a single static binary. Node Exporter monitors a host by exposing its hardware and OS metrics which Prometheus pulls from.
How to Install Node Exporter
To monitor your entire deployment, you’ll need a node exporter running on each node—this can be configured through a DaemonSet. Prometheus has a good quick start resource on this in their public repo.
You can use Helm—the package manager—to install Prometheus in one line:
1 |
helm install prometheus-operator stable/prometheus-operator --namespace monitor |
Alternatively, you can wget a tar file through GitHub and unzip it:
1 2 3 4 |
wget https://github.com/prometheus/node_exporter/releases/download/v*/node_exporter-*.*-amd64.tar.gz tar xvfz node_exporter-*.*-amd64.tar.gz cd node_exporter-*.*-amd64 ./node_exporter |
After installation, verify that the monitors are running on the Pods:
1 |
kubectl get pods -n monitor |
You should see Prometheus, Grafana, which is an included open-source analytics platform, node-exporter, and kube-state-metrics on the Pods.
How to Use the Node Exporter and View Your Kubernetes Metrics
This Prometheus Node Exporter exposes an endpoint, /metrics, which you can grep. The node exporter scrapes targets at a specified interval, attaches labels to them, and displays them through a metrics URL as text or a protocol buffer. Alternatively, this is available through https://localhost:9100/metrics.
You can also explore these metrics through the Prometheus console dashboard to get specific information. The dashboard and Prometheus metrics can be seen through https://localhost:8080/docker/prometheus. This is different from the Prometheus web UI, where you can explore container metrics through expressions.
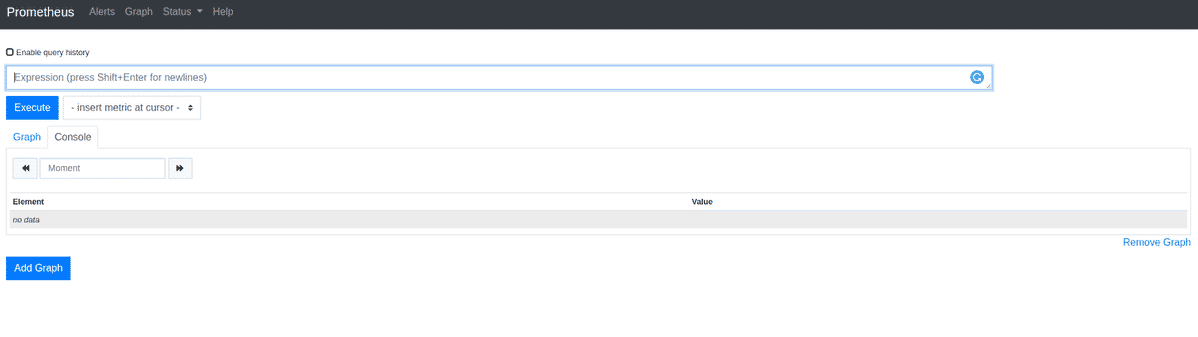
The scraped metrics get saved to a database that you can query using PromQL through this web console. For example, a query to select all the values of the HTTP GET requests received in your staging, testing, and development environments would be:
1 |
http_requests_total{environment=~"staging|testing|development",method!="GET"}
|
It is intuitive to query for a number of other summary metrics such as average, max, min, or specific percentiles. Prometheus also allows you to set up alerts through email, Slack, and other supported mediums that get triggered based on conditions via Alertmanager. For example, you can set a trigger to send a high priority Slack message when a P90 is hit on various account creation failures.
How to Set Up Alertmanager
There are a couple of options to install Alertmanager. You can bootstrap a Prometheus deployment through Helm Charts directly with a single command.
1 |
helm repo add prometheus-community https://prometheus-community.github.io/helm-charts |
Otherwise, you can download and extract the latest Alertmanager tar from Prometheus’s official download link. This will link you to the latest version on GitHub, which you can fetch using the code snippet below.
After installation, you can start Alertmanager on localhost port 9093 and begin setting up alerts through the communication channels mentioned above.
Note that CAdvisor, Google’s solution for natively monitoring Kubernetes, can also be used alongside Prometheus to view metrics out of the box. You can explore the metrics through the CAdvisor web UI.
Managed Hosting Through Prometheus, Grafana, New Relic, and Datadog
Once you set up the metrics you’re interested in, you can aggregate and display them through dashboards on a hosted backend. Hosted backends include Grafana Cloud, New Relic, Datadog, or you can self-host through Prometheus as discussed earlier.
There are some benefits to locating your metrics servers on premises, but it’s generally poor practice. Exceptions include very large entities with data servers distributed across the world, or those who have strong restrictions around highly sensitive data.
Keeping metrics on-premises results in a single point of failure that cannot be root caused if your metrics are down. Benefits include control over your security protocols and monitoring services, but these will be less robust than cloud platforms unless very well planned.
Thankfully, there are several hosted options for Prometheus and metrics dashboarding. Let’s break down the differences between the most popular:
Hosted Prometheus Pricing
- Pricing: Freemium. Can be used as a managed service on Cloud Services.
- AWS Example: Up to 40 M samples and 10 GB of queries free. $0.90/10 MM samples for the first 2 billion samples.
- Type: Dashboard
- My Thoughts: Self-hosting your metrics and alerting instances creates a single point of failure that can be critical. Another option is that you can instead host it on cloud providers and replicate in multiple AZ/regions.
Grafana Cloud
- Pricing: Freemium. Free account with 10,000 series for Prometheus metrics, 50 GB of logs, 50 GB of traces, and 3 team members.14 day free trial for Pro. $49/mo + usage afterward.
- Type: Dashboard
- My Thoughts: Grafana is a good tool that is natively bundled with Prometheus for dashboarding. Grafana Cloud maintains Grafana for you—including updates, support, and guaranteed uptime.
NewRelic
- Pricing: Freemium. Free account for 1 admin user and unlimited viewing users with 100 GB/mo for ingestion and 8+ days retention, with unlimited querying, alerts, and anomaly detection.
- $0.25/GB above 100 GB.
- $99/user above the first.
- $0.50/event above 1000 incidents.
- Type: Monitoring tool
- My Thoughts: New Relic can be cheaper with lots of hosts, while providing a competitive base of features similar to the ones provided by Datadog. This is because you pay on ingress/egress rather than number of hosts.
DataDog
- Pricing: Freemium.
- Free account up to 5 hosts.
- Infrastructure
- $15/mo per host for Pro plan.
- $23/mo per host for Enterprise plan.
- Logging
- $0.10/GB for ingestion.
- $1.70/MM events for 15 day retention.
- See pricing page for other services.
- Type: Monitoring tool
- My Thoughts; Datadog is a pricier option as you need to opt into multiple services while the others are bundled.
Key Kubernetes Metrics to Monitor
Once you’ve chosen a service provider, it’s time to set up a list of key metrics. Triggering metrics through severity standards is a good approach here. You can set up a range of alerts, from Severity 1 for individual-productivity problems, to Severity 5 for breaking issues impacting customers worldwide. For these issues, you might want to consider metrics around system performance. This could include CPU, memory, disk space, plus network usage and their trends. Below, you can see a few examples to start off:
CPU Usage
100 - (avg(irate(node_cpu{mode="idle", instance=~"$instance"}[1m])) * 100)
Memory Usage (10^9 refers to GB)
node_memory_MemAvailable{instance="$instance"}/10^9
node_memory_MemTotal{instance="$instance"}/10^9
Disk Space Usage: Free Inodes vs. Total Inodes
node_filesystem_free{mountpoint="/", instance="$instance"}/10^9
Network Ingress
node_network_receive_bytes_total{instance=”$instance”}/10^9
Network Egress
node_network_transmit_bytes_total{instance=”$instance”}/10^9
Cluster CPU Usage
sum (rate (container_cpu_usage_seconds_total{id="/"}[1m])) / sum (machine_cpu_cores) * 100
Pod CPU Usage
sum (rate (container_cpu_usage_seconds_total{image!=""}[1m])) by (pod_name)
IO Usage by Container
sum(container_fs_io_time_seconds_total{name=~"./"}) by (name)
Conclusion
Although Kubernetes monitoring is more complex, there are a number of viable options to facilitate the process. We discussed how Node Exporter can help you export metrics, compare different hosted monitoring service options, and explore some key metrics to utilize for monitoring memory, network, and CPU usage.
Once you’ve decided to implement your monitoring stack, consider revisiting your Kubernetes administration and exploring cost reduction through CloudForecast new k8s cost management tool, Barometer.

Sean Bangalore
Sean is a Software Development Engineer at Amazon and interested in software, artificial intelligence, and quantitative finance.
Blog
More from CloudForecast


Cloud Cost Management is Easy With CloudForecast
We would love to learn more about the problems you are facing around AWS and Azure cost. Connect with us directly and we’ll schedule a time to chat!
Start Free Trial