Dashboards
The Dashboard Tool is a set of interactive dashboards that gives you granular visibility into your AWS cost. We have processed your billing CSV file from your AWS account into a set of accessible and easy to read dashboards. With the dashboards, you’ll see detailed cost information across your AWS account.
Important note: All of the time based graphs (year, month, date, hour) are reported in UTC timezone.
Navigating Between the Dashboards
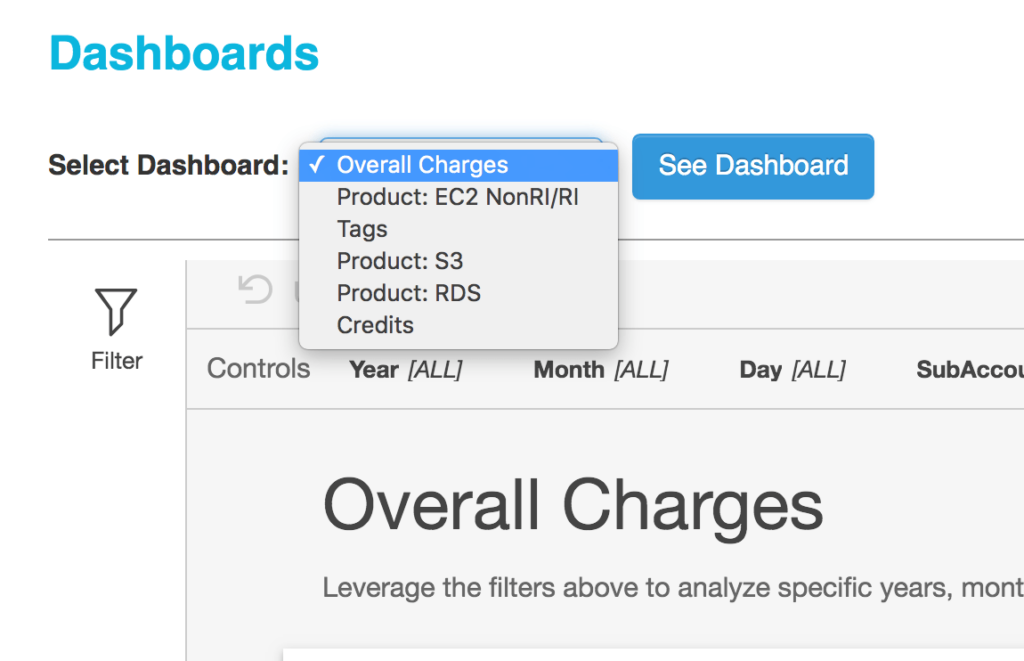
By default, there are a total of six dashboards available for you:
- Overall Charges
- Product: EC2 (RI & Non-RI)
- Product: S3
- Product: RDS
- Tags
- Credits
To navigate to this set of dashboards, click the drop-down box, select the dashboard you want to view and click “See Dashboard”.
Need a custom dashboard made for you? Email us at [email protected] for a custom request.
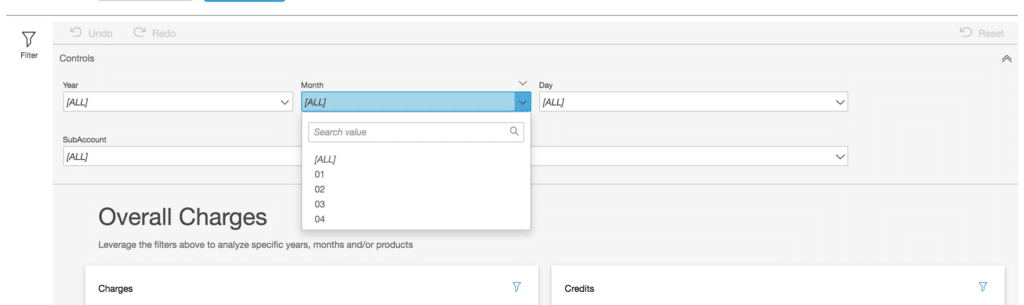
Controls and Filters
You are given a set of controls such as Time Range (Year, Month, Date) and Sub Accounts to overlay on top of the graphs/charts. We currently support historical data back to Jan 1, 2019. Please email us at [email protected] for a custom request of data prior to Jan 1, 2019.
How to Drill Up and Drill Down
To interact and “drill down” into the multiple layers of your cost, hover over any of the charts and left click on any of the assets. You will then be presented with a set of options to drill down further.
For the charts, you are given two options to drill up or drill down:
- Drill up and down by date ranges: Yearly > Month > Day > Hour > Minute
- Drill up and down by category:
- EC2: (RI > Operation > UsageType > ItemDescription)
- RDS: (Operation > UsageType > ItemDescription)
- Tags: (TagType > TagKey > TagValue > ProductName > Operation)
- S3: Bucket > Operation > UsageType > ItemDescription